Introducing the ClinReg Benchmark for Life Sciences. This post walks through what we measured, what surprised us, and what it means for anyone deploying AI in clinical and regulatory settings.

Accuracy is the whole game
In regulated life-sciences work — screening literature for post-market surveillance, extracting structured data from clinical documents and generating regulatory submissions, and generating tables, listings, and figures (TLFs) based on clinical trial data — a wrong answer isn’t just an inconvenience. A silently missed paper in a systematic review or a fabricated value in a data-extraction table can propagate into a regulatory submission. In the life-sciences context, accuracy matters most given the high stakes.
The prevailing assumption has been that only closed, frontier models can be trusted with tasks like these. We put that assumption to the test — and found it no longer holds.
Within life sciences, most benchmarking attention has gone to discovery. Structure prediction has CASP, the decades-old blind assessment that AlphaFold turned into the field’s canonical measuring stick. LAB-Bench and BixBench probe whether agents can reason over biology literature and run real bioinformatics analyses — BixBench, notably, is hard enough that frontier models scored in the single-digit-to-teens percent range at release. Coscientist showed an LLM planning and executing its own chemistry experiments on lab hardware. That work matters, but it measures the front of the pipeline. The money and the years are at the back: the Congressional Budget Office puts discovery and preclinical work at about 31% of pharmaceutical R&D spend — roughly $474M per approved drug — against about $1.07B for clinical trials, and about 95 months in the clinic versus 31 months preclinical. Other regulated professions have started measuring their own equivalent of that back half. Harvey’s Legal Agent Benchmark scores agents on more than 1,250 real law-firm assignments against expert-written rubrics; OpenAI’s HealthBench and Stanford’s MedHELM cover clinical care tasks; FinanceBench tests analyst questions against public filings. Outside any one vertical, GDPval is the closest to a general “real professional work product” benchmark, but does not cover regulatory submissions. Regulatory and clinical-trial workflows — where a life-sciences program spends most of its time and money — has had no public equivalent. ClinReg is our attempt at one.
“ClinReg” spans three real regulatory and clinical-trial tasks. We ran the leading open-weight and closed-weight models through it. The headline: across all three tasks, open-weight models now fall within the variance band of closed-source models on accuracy. And they do it at a fraction of the cost — the cost gap is significant, with open-weight models running 3x cheaper than the best scoring model we tested, and ~10x cheaper than the most expensive frontier models.
We'll now walk through what we measured, what surprised us, and what it means for anyone deploying AI in clinical and regulatory settings.
Three things open-weight models buy you
For our customers, moving high-stakes workloads onto open models comes down to three value propositions:
Accuracy at a fraction of the cost. If open-weight models match frontier on the task that matters, the economics change completely.
Infrastructure robustness. Frontier models often run into capacity and infrastructure issues. By shifting the load to open-weight models, teams can achieve enhanced robustness and higher uptimes on their workloads.
Data sovereignty. Beyond accuracy and reliability, the open-weight model value proposition is also about data sovereignty — not leaking data to external providers.
The rest of this post is about proving the first point rigorously, because without it the second and third ones don’t matter.
Results: Open-weight is at parity on accuracy
Details on the ClinReg Benchmark tasks, datasets, evaluations, skills, harness, inference provider and score computation are provided in the Appendix.
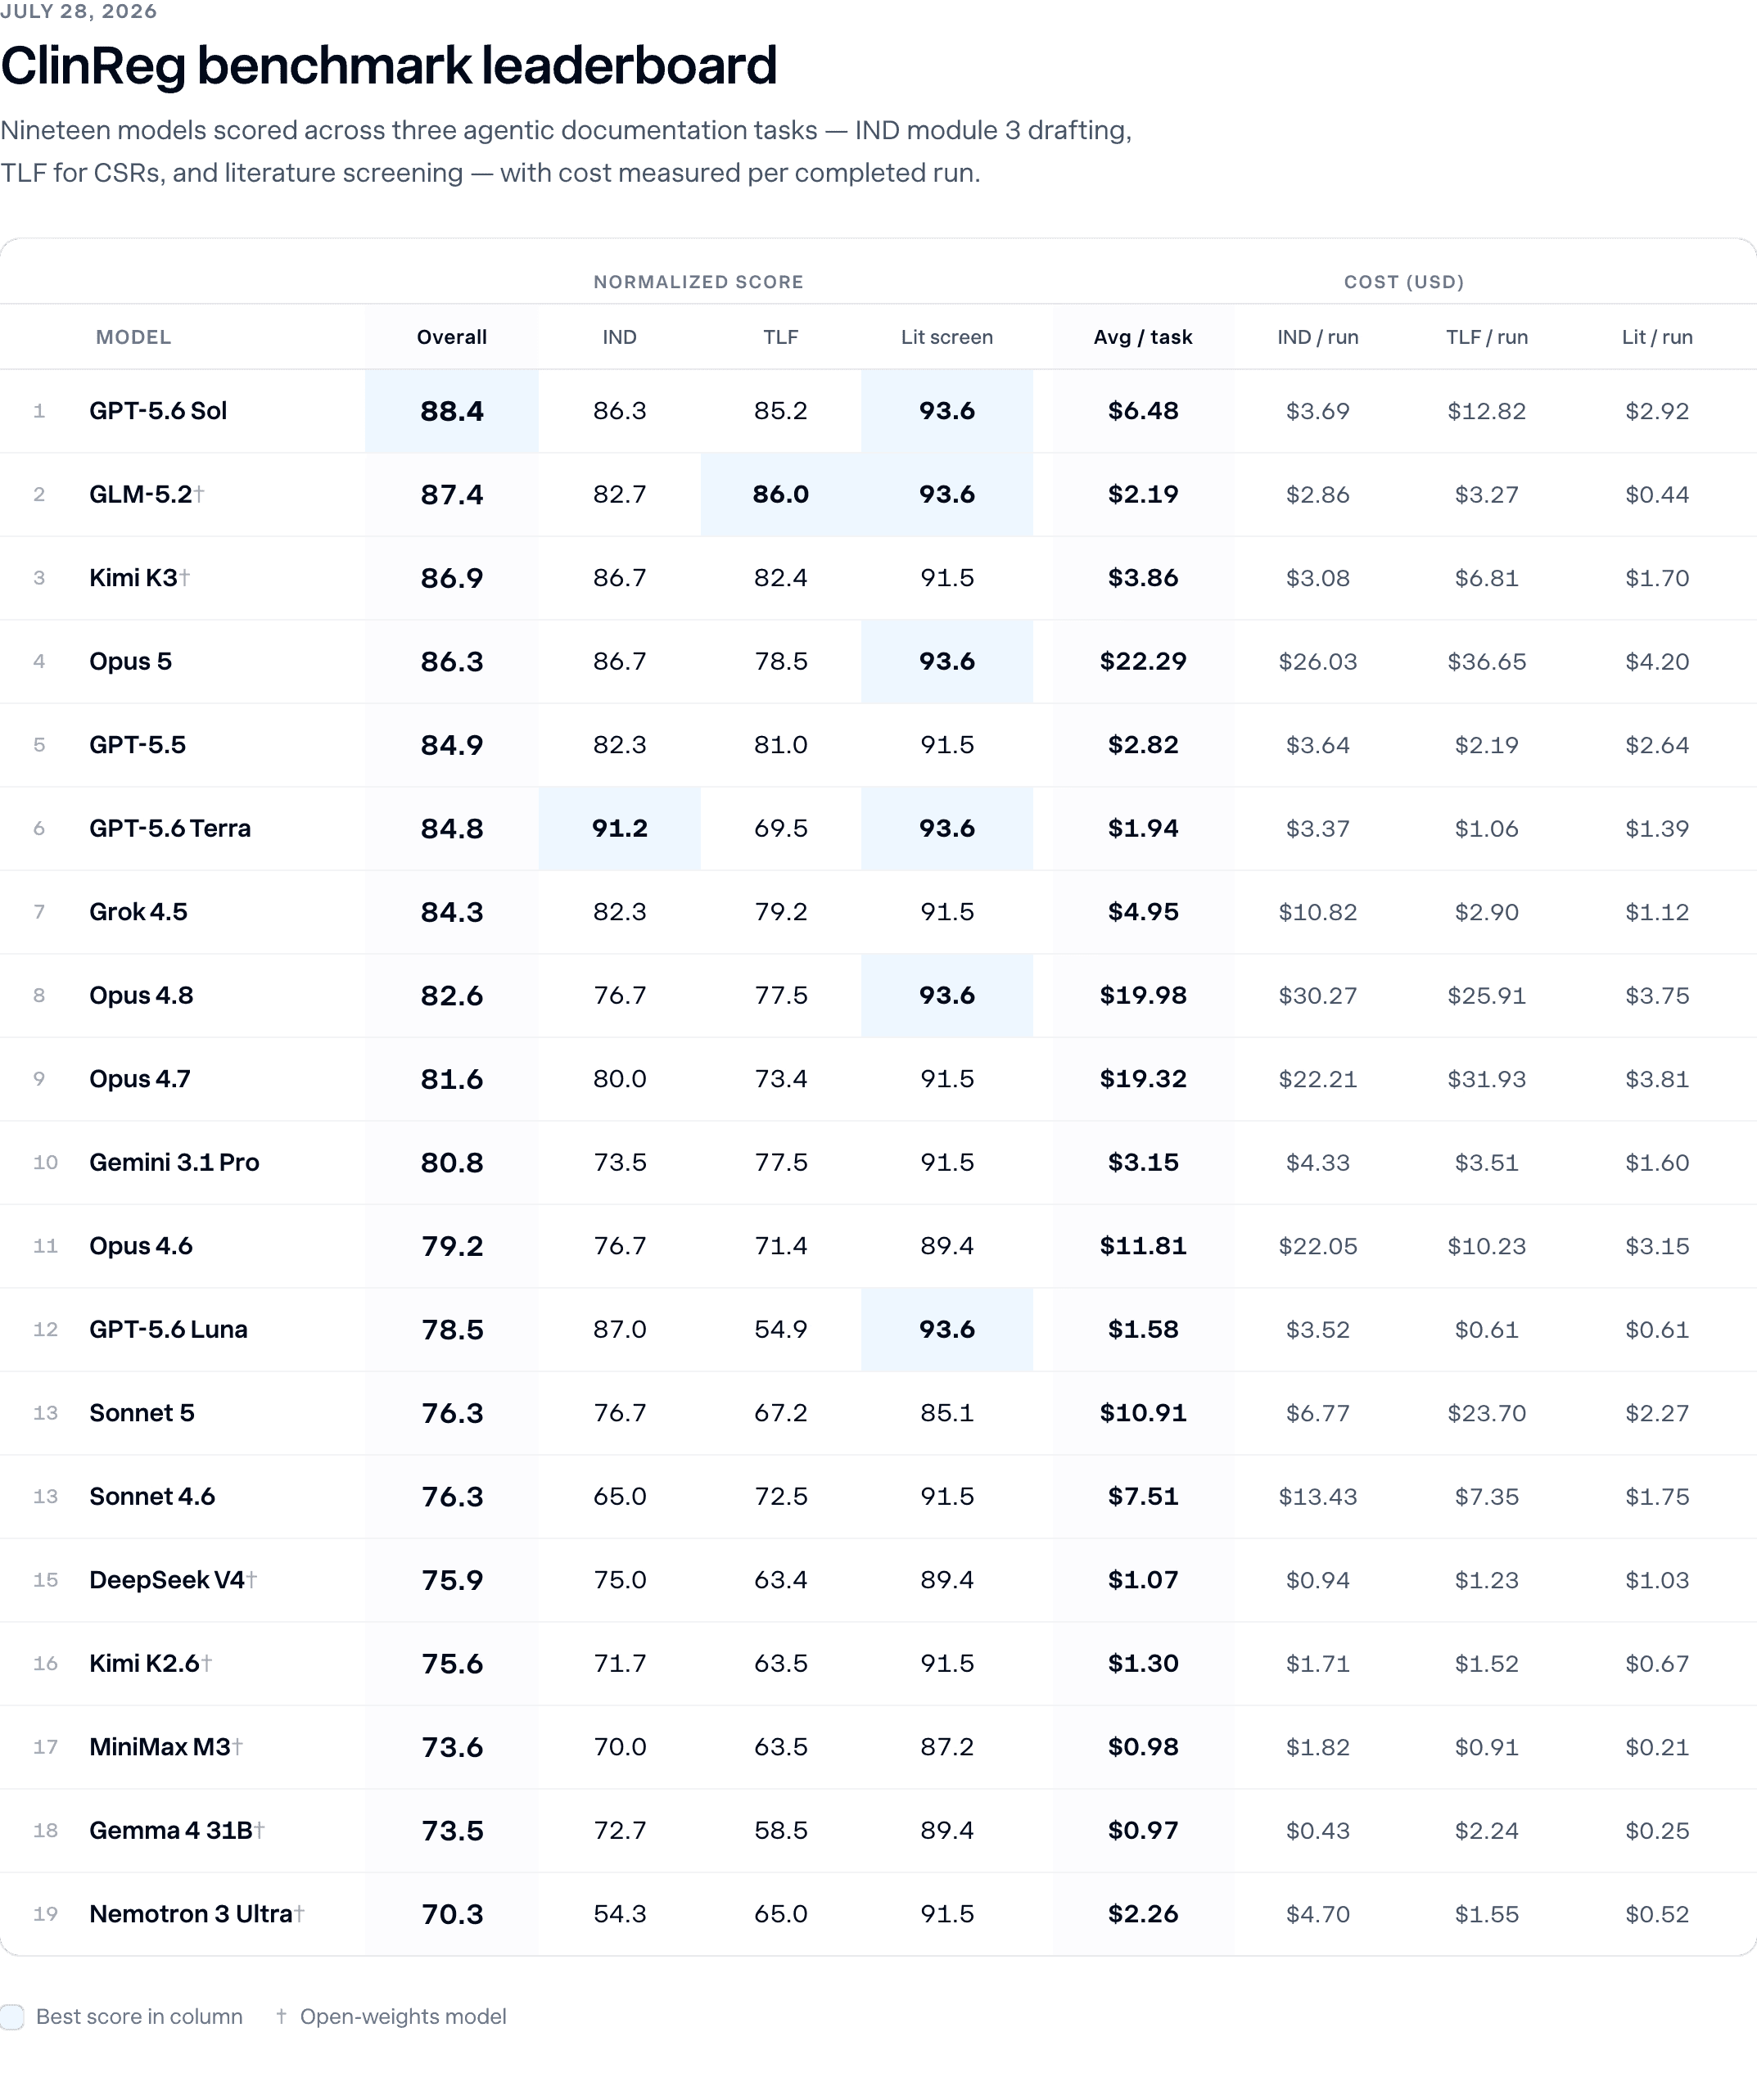
We measured the “Overall Score” (see Appendix) across 19 models (12 proprietary and 7 open-weight). We found that GPT 5.6 Sol had the highest overall score (88.4; std dev=4.6) on the ClinReg benchmark, followed closely by open-weight models GLM 5.2 (87.4; std dev=5.6) and Kimi K3 (86.9; std dev=4.6). GLM 5.2 and Kimi K3 were 33.8% and 59.6% of the cost of running GPT 5.6 Sol on average per task. Thus, we see that open-weight models are now well within a standard deviation of the best performing proprietary model. Just a few months ago, the best performing models were Opus 4.8/4.7 which were ~9x the cost of GLM 5.2 on this task, indicative of the fast-pace of cost and accuracy improvements.
Just behind these models, we saw a cluster of proprietary models with similar accuracy but a wide-spread in cost: GPT 5.6 Terra, GPT 5.5, Grok 4.5 and Opus 5 ranging from 84.3-86.3 overall score, but with a 11x cost spread.
The best US open-weight models however were the lowest performers in our list: Gemma 4 (73.5) and Nemotron 3 Ultra (70.3). Within each model family we see that subsequent versions of models led to better accuracy for both proprietary (for e.g. see GPT 5.5 -> GPT 5.6 Sol, or Opus 4-6 -> 4.7 -> 4.8 -> 5) and open-weight models (for e.g. Kimi 2.6 -> 3). Within the GPT 5.6 model family, the overall score (Sol > Terra > Luna) tracked the performance and cost rankings from OpenAI. Similarly the Opus family performed better than Sonnet.
Fable 5 and Muse Spark 1.1 refused our benchmark tasks on biological-safety grounds and were omitted from this analysis. We found that the Opus and Sonnet costs were higher than those of other model families. How much this was impacted by the harness (Claude Code) vs. the model itself is something we plan to study next.
Observations by task
Literature screening. Across the literature screening task, performance was tightly clustered at 85–94% (a spread of 40-44 correct articles), suggesting that all evaluated models handled this classification setting well. Accuracy alone, however, obscures meaningful behavioral differences: models made errors on different papers and applied inclusion or exclusion criteria differently. Some models favored recall (e.g. Sonnet 4.6 and Gemma 4), while more conservative models such as MiniMax and DeepSeek excluded more articles. In practice, this makes model selection less about a single headline score and more about whether its error profile matches the review team’s tolerance for missed studies versus additional manual review.
For the IND and TLF tasks, we collected traces of the agentic runs, and analyzed these to understand the error patterns.
IND: restraint mattered more than persistence. Models were broadly reliable at extracting information explicitly present in the source; the larger differences appeared when required fields were absent. The best-performing models (GPT 5.6 family and Kimi K3) balanced coverage with faithfulness, drafting complete documents without filling gaps with plausible but unsupported details. Some models were highly cautious and avoided fabrication but omitted real content (e.g. Gemini 3.1 Pro), while others pursued completeness by inventing unstated values (MiniMax M3). Otherwise capable frontier models (Opus family and Sonnet 5) also fell behind when they committed to specifications or methods that the source did not support.
TLF: iteration separated the models. Every model produced syntactically valid Python on its first attempt; the differentiator was how it responded to runtime errors and used the validation loop. The GPT model family wrote clean code quickly and patched errors in place, but occasionally declared the task complete while fixable issues remained. Others such as Opus 4.8 and Grok 4.5 repeatedly refactored entire scripts, while top open-weight performers such as GLM-5.2 and Kimi K3 continued iterating until their checks passed. At the other end, Gemma and DeepSeek V4 invested many iterations without consistently converging on the correct result, suggesting that persistence cannot fully compensate for capability limits. Under this evaluation setup, performance reflected both model capability and operating style—particularly how models repaired mistakes and decided when the work was complete. These results also highlight the influence of the surrounding harness: stronger validators and more explicit stopping criteria could improve outcomes, especially for models prone to exiting early.
Together, TLF and IND reveal complementary model behaviors: TLF rewards sustained iteration, while IND rewards restraint. Capability puts a model in contention, but task-specific behavior—and the acceptance criteria encoded in the harness—can determine where it ultimately performs best.
Getting evaluation right
In the process of creating this benchmark and constructing the evaluations (see Appendix), we had several learnings. These are especially relevant for tasks when there isn’t human ground truth – for our ClinReg benchmark this was applicable to the final Module 3 output, and intermediate stages of TLFs such as code gen. We share a few of these observations below.
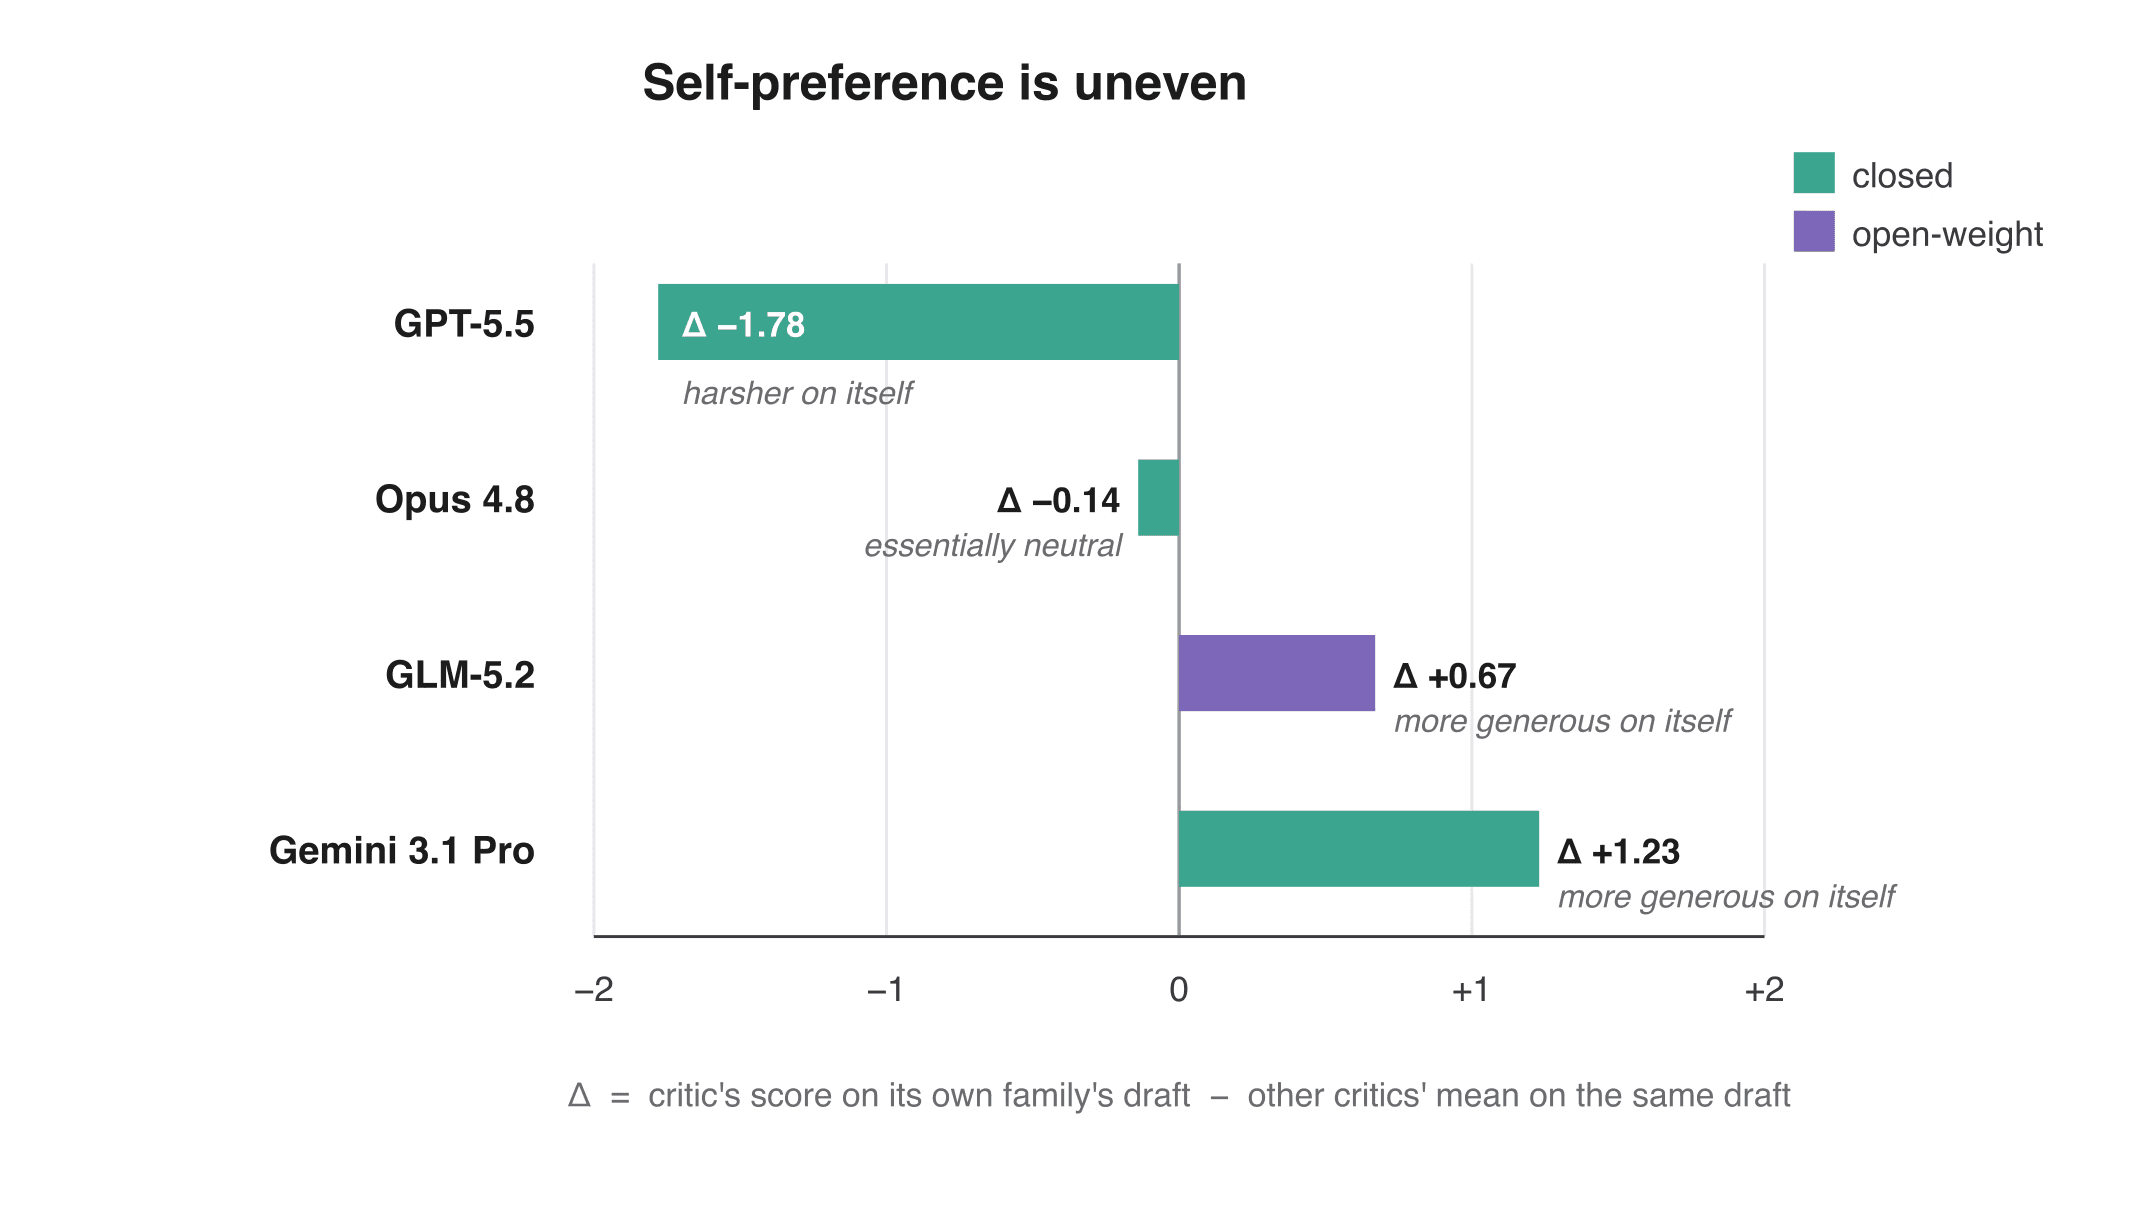
Don’t trust a single LLM judge. As has been reported elsewhere, we also found LLM-as-a-judge scoring on a 0–10 scale to be unreliable with different models assigning different scores to the same output. In our own preliminary analysis on the IND task, we found the models when used as critics to be operating on different scales – Gemini 3.1 Pro and GLM 5.2 were lenient (mean score of 8/10), and GPT 5.5 was strict (mean score of 6/10). Even self-preference patterns were uneven: Gemini 3.1 Pro and GLM 5.2 preferred their own output, but GPT 5.5 was harsher on itself.
In order to minimize the impact of these differences, we used a couple of strategies:
For IND scoring the four judges surface findings rather than scores, and a “chairman” model reviews those findings, assesses severity, and assigns the score.
For the critic panel in the TLF task, we used the median score from the 3 critics
Use deterministic metrics. For the IND task, we introduced 2 metrics (Omission rate and fabrication rate) related to the intermediate data extraction task (108 fields) which could be objectively measured and scored by the judge models. Omission rate and fabrication rate are fully deterministic — omission rate captures when a model marks a present field as missing to avoid penalty, and fabrication rate is when a model outputs an incorrect value for a present field. Interestingly, these metrics revealed two different failure modes: Opus 4.8 had a higher omission rate but a lower fabrication rate compared to GLM 5.2.
In-loop validation and task decomposition: Along with the evaluation performed at the end of the task, another important factor is in-loop validation – i.e., validation done within the execution of the task. Agentic workflows need strong validators, stopping rules and acceptance criteria defined into their Skills for recursive self-improvement (whereby the output improves iteratively) to work. Defining validators is straightforward when they are deterministic or objectively defined. When the validator is probabilistic or subjective (as in the case of LLM-as-a-judge) similar considerations to what we outlined above apply in order to get the benefit of recursive self-improvement.
In practice, subject matter experts can play a big role in defining the acceptance criteria as they are closest to the details of each task. Decomposing tasks with intermediate sub-tasks within the Skill (for e.g. the intermediate data extraction task in the IND task) has the added benefit of improving accuracy by providing concrete milestones for the agent to self-improve against, rather than having to rely on abstract, high-level feedback.
Tracing the agentic runs is another useful design pattern. Traces can be useful for error analysis, as well as for downstream fine-tuning or reinforcement learning to further improve accuracy and costs.
Takeaways
Open-weight models have reached accuracy parity on regulatory work. The best open-weight models in our set — GLM-5.2 (87.4) and Kimi K3 (86.9) — land within one standard deviation of the best closed model we tested (GPT-5.6 Sol, 88.4). Across literature screening, IND Module 3 authoring, and TLF generation, the open-vs-closed line no longer predicts who is at the top.
The cost gap runs one direction, and it is large. GLM-5.2 reaches that score at roughly a third of GPT-5.6 Sol’s cost per run and about a tenth of Opus 5's. At the volume a real regulatory program runs, that is the difference between a line item and a budget conversation.
Parity is not uniformity. Models with nearly identical headline scores failed in visibly different ways: some fabricated values to fill gaps while others omitted values; some iterated until validation passed while others declared victory with fixable errors still in place. Two models a point apart on the leaderboard are not interchangeable in production. Choose on error profile, not on rank.
The harness is part of the model. Every agentic result here is a model and a scaffold — validator strictness, stopping criteria, retry behavior. Under our setup, several results moved more with how a model was run than with which model it was.
US open-weight models lagged non-US counterparts. The strongest open-weight results came from GLM-5.2 and Kimi K3. The best US open-weight models were the lowest performers in our set — Gemma 4 31B (73.5) and Nemotron 3 Ultra (70.3).
The headline is that open-weight models have caught up. The consequence is that model choice has become the easy part. What’s left is engineering: which model and harness fit the task, how skills and in-loop validation encode acceptance criteria, and which inference provider you route to at what cost and latency. That complexity doesn’t disappear — it moves. Everest and the Log10 team absorb this complexity so life-sciences organizations can focus on the deliverable. We hope standardized benchmarks like ClinReg raise confidence in what AI can do for regulatory and clinical-trial workflows, and ultimately help cut the time and cost of bringing new drugs and devices to market.
We welcome feedback and additions to our set of ClinReg benchmark tasks, which we plan to open source in the future. Please contact ai@log10.io
Appendix: ClinReg Benchmark suite
We designed a benchmark suite (“ClinReg”) around three tasks that mirror real regulatory and clinical-trial work using publicly available data:
1. Literature screening: Using the Cochrane task
Task and dataset
Literature screening is the first benchmark task. It uses CLEF eHealth TAR topic CD009593, based on a Cochrane diagnostic-accuracy review of Xpert MTB/RIF for pulmonary tuberculosis and rifampicin-resistance detection in adults (link). CLEF TAR repurposes real systematic-review workflows as reproducible screening tasks.
The task mirrors two stages of a systematic review: title/abstract screening determines which records proceed to full-text review; full-text screening determines final inclusion or exclusion and the applicable reason. Screening criteria were human-curated from the source review’s published eligibility criteria and translated into a fixed, ordered instruction before evaluation. Models apply the same instruction; they do not generate or rewrite the review protocol.
Although this is an independent Cochrane review rather than a formal post-market-surveillance programme, its evidence-screening workflow is a realistic, public proxy for the literature-surveillance component of post-market surveillance and diagnostic-device performance evaluation.
Evaluation
We currently report full-text screening results only. The evaluation set contains 47 articles with publicly available full-text PDFs from PubMed Central and other web sources, and final human review labels: 20 included studies and 27 excluded studies. Each model makes one include/exclude decision per article.
Normalized Literature Screening Score measures overall decision accuracy:
Normalized Literature Screening Score = 100 * (#correct inclusions and exclusions) / 47
We also report the total provider cost to screen the 47-article evaluation set, calculated from recorded token usage. The Cochrane review provides human-recorded exclusion reasons for excluded studies, enabling later audit of a model’s rationale.
2. Module 3 IND writing
Task and dataset
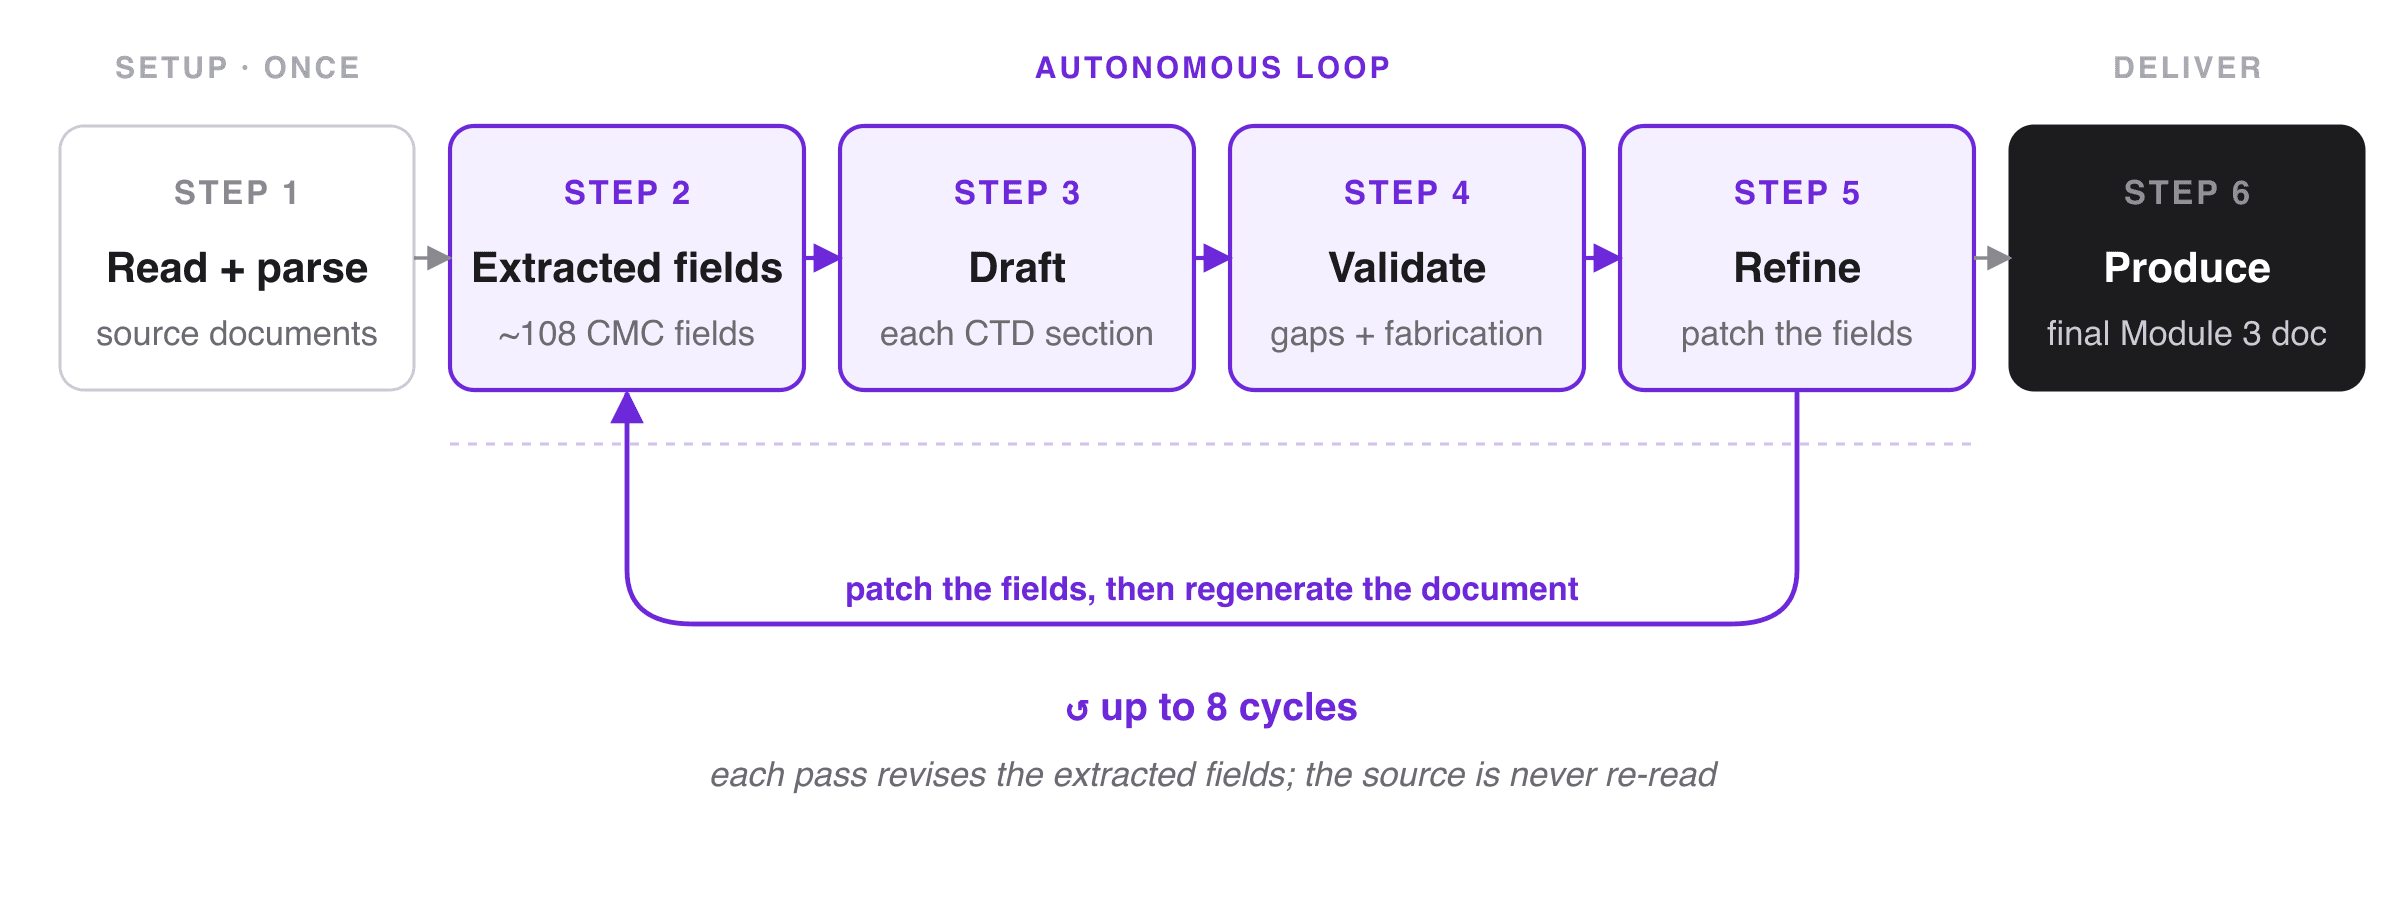
We model a draft regulatory filing: the Chemistry-Manufacturing-Controls section (i.e., Module 3) of an IND application (to the FDA). This is a proxy for the actual work of authoring an IND. A real submission is drafted from a company’s own proprietary manufacturing and analytical data; to turn it into a benchmark, we swap that private source for a public one that carries similar information. We hand the model a single dense assessment report, the European regulator’s published review (EPAR) of an approved antibody-drug conjugate, and ask it to reconstruct the Chemistry-Manufacturing-Controls section of an IND application, from that source alone. It is not a single-turn question with an answer; it is a sustained, agentic job the model has to run end to end. A key aspect of the agentic job is extracting 108 fields from the EPAR report and incorporating those data points in the right way for the Module 3 creation.
Evaluation
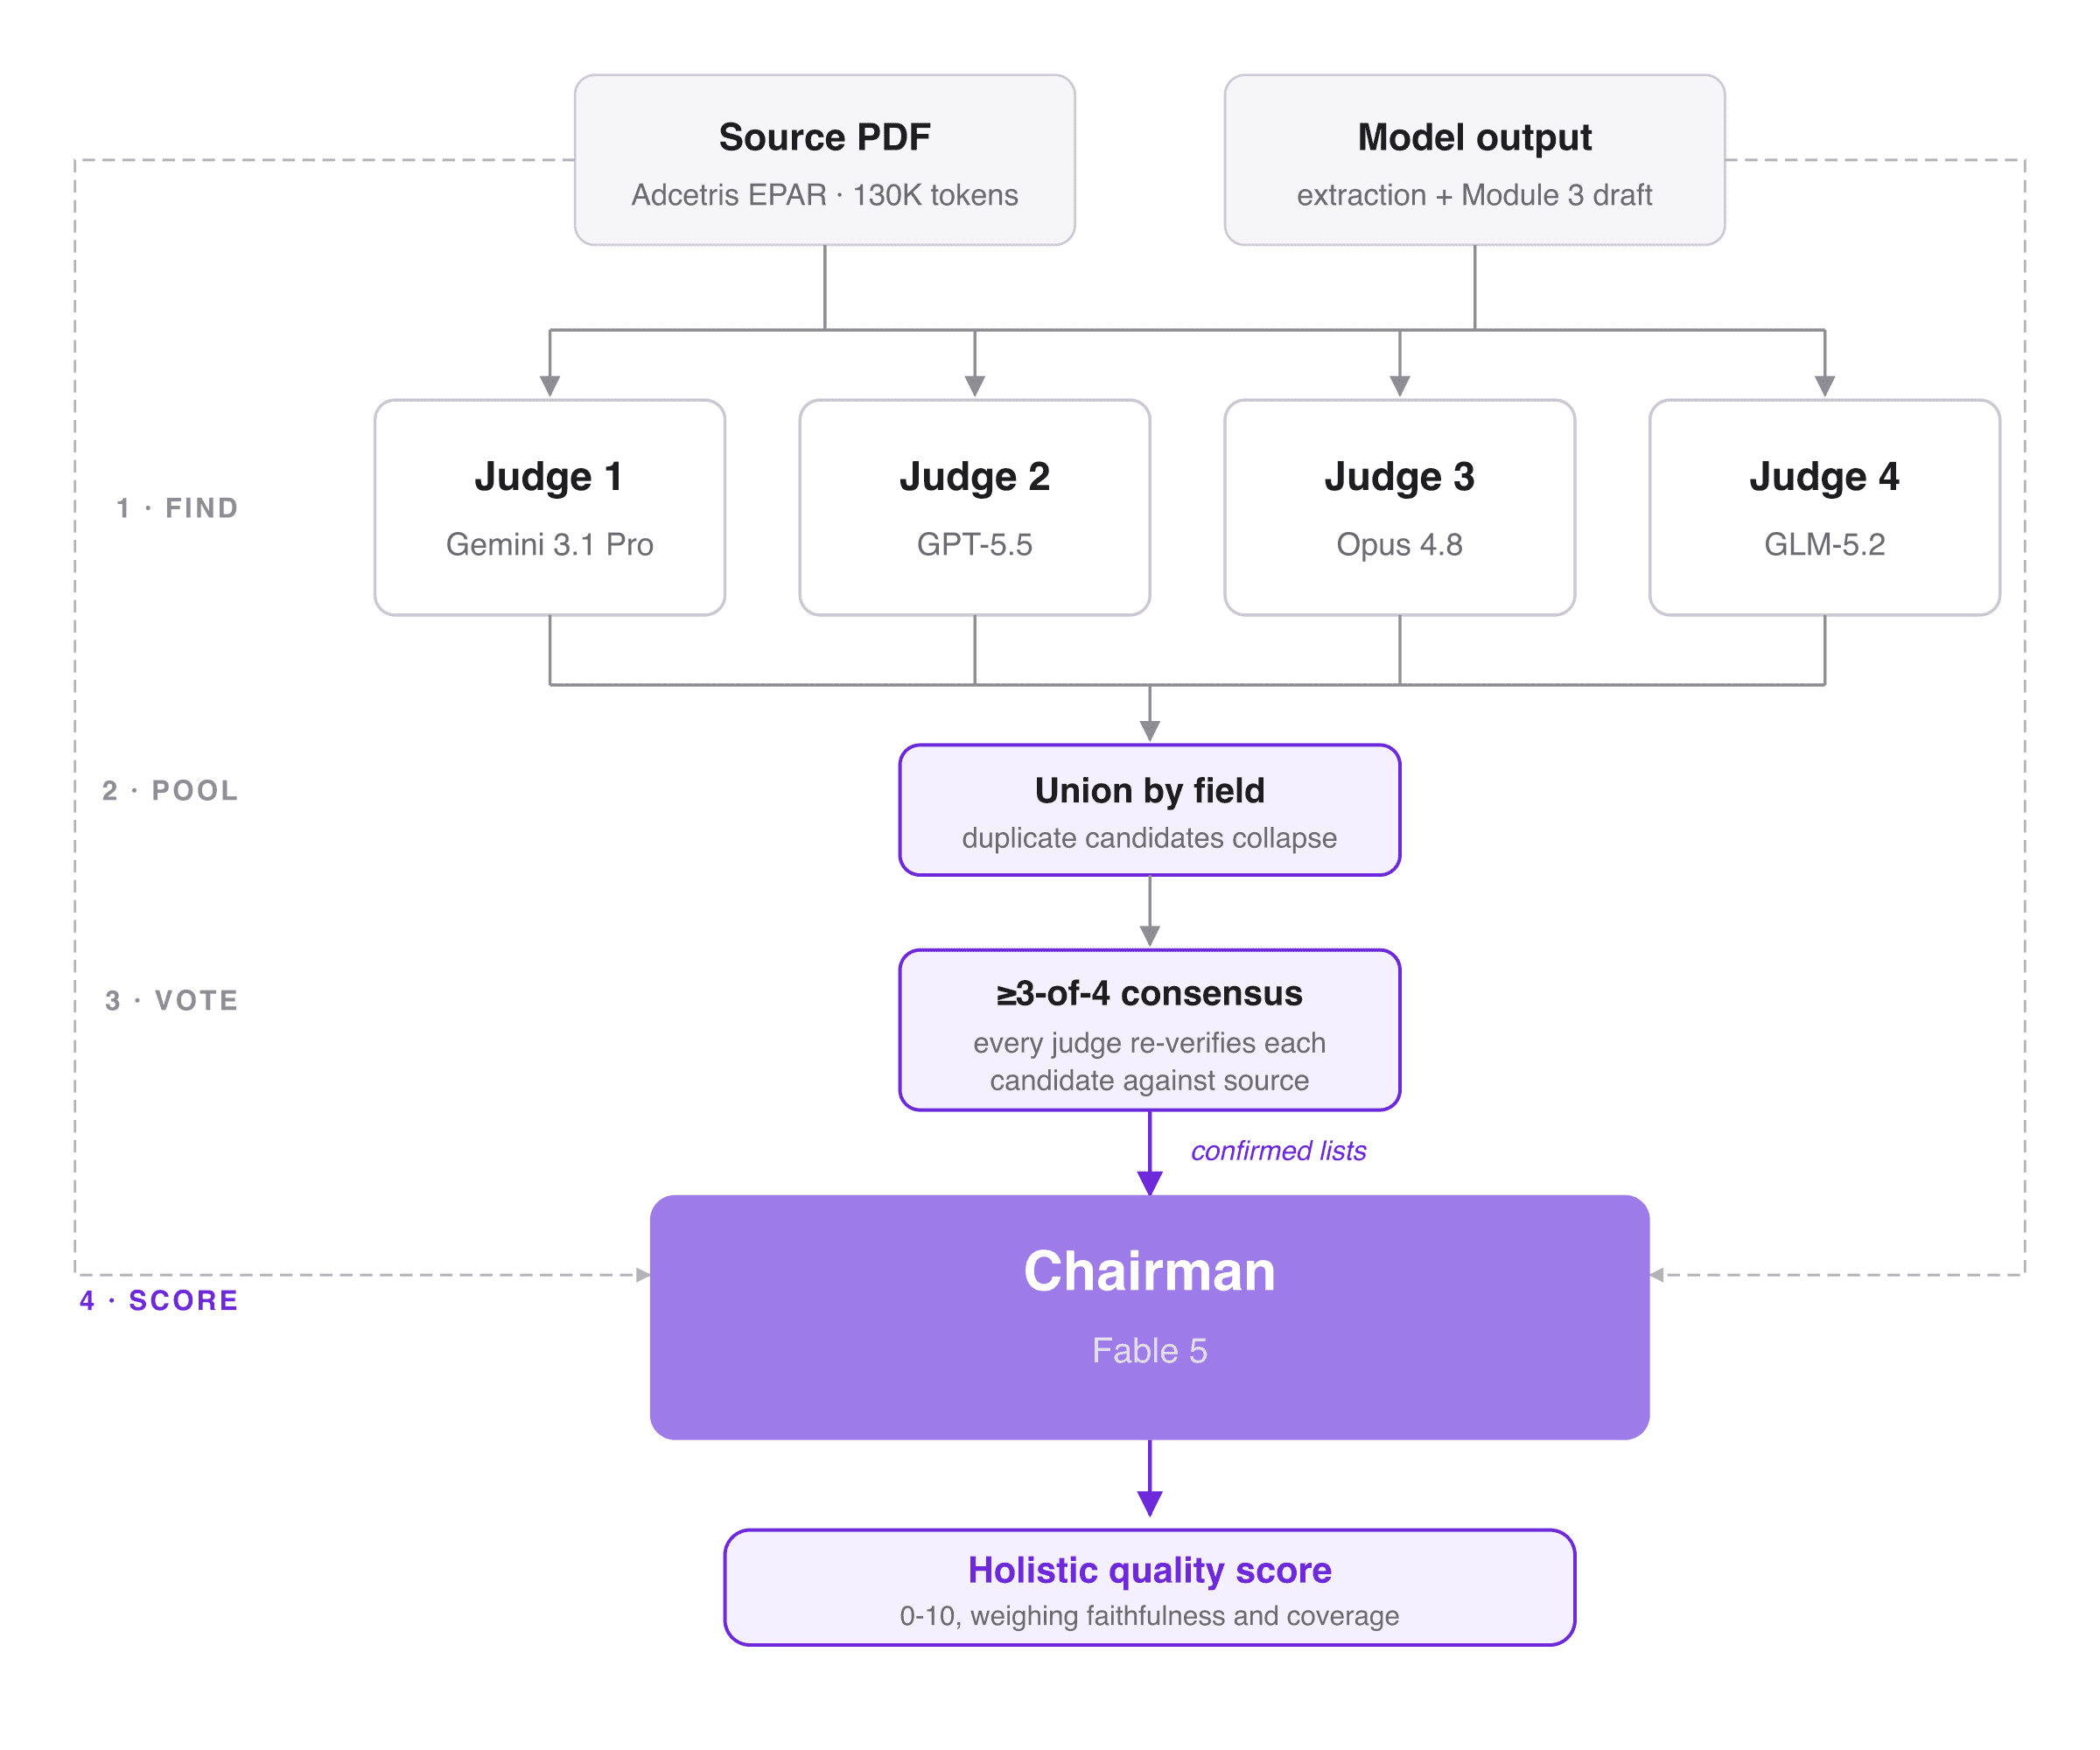
This task used an LLM-as-a-judge setup to assess how faithfully and completely each model reconstructed the CMC content from the EPAR. Details are below, but in brief: a four-model judge panel finds and cross-verifies evidence of errors, and a single arbitrator turns that evidence into one holistic 0–10 quality score.
Four judges (Gemini 3.1 Pro, GPT-5.5, Opus 4.8, and GLM-5.2) each list two kinds of structured evidence:
fabrications (populated fields whose specific value isn’t stated in the source, like invented limits or manufacturer identities) and
omissions (fields the source clearly states but the model marked MISSING or vague).
Standard citations (ICH Q1A, USP <71>) are excluded from fabrications; they’re boilerplate. Fields the source genuinely leaves silent are not omissions; honest gaps are correct. Every candidate is re-verified against the source, and only those confirmed by at least three of the four judges count as correct. A single “Chairman” model then scores the two confirmed lists, reading the source and the model’s output alongside them.
Note on “Chairman” model: We initially chose Fable 5 (for some degree of model family independence), but it declined our prompts due to its biological safety trigger, and routed to Opus 4.8 instead. We acknowledge that this creates the possibility of a self-preference bias for Opus family models. Two things argue against it distorting our results. First, the design: judges emit source-verified evidence rather than scores, and confirmation needs three of four votes, so no single judge can suppress a finding against itself. Second, we measured it. In the preliminary critic analysis above, Opus 4.8 showed the smallest self-preference of the four models tested (Δ = −0.14 on a 0–10 scale, against +1.23 for Gemini 3.1 Pro and +0.67 for GLM-5.2) — it was, empirically, the least self-favoring judge available to us.
Normalized IND score (out of 100) is calculated by multiplying the 0-10 score by 10. Each model was run 3 times and the mean score across the 3 runs was used.
3. TLF generation (for clinical study reports)
Every drug approval at the FDA rests on a specific technical dossier built around the trial’s tables, listings, and figures (TLF): the pre-specified analyses showing who was treated with what, which adverse events happened at what rate, and whether the primary efficacy endpoint moved the way the sponsor claimed. The FDA doesn’t work from the raw case-report forms. It reviews the standardized datasets behind every reported number and re-runs the analysis programs that produced them. The sponsor submits that whole traceable stack, the analysis-ready datasets, the standardized tabulations they were derived from, and the programs that generated all of it, packaged into an electronic submission a reviewer can execute end to end to reproduce any headline result.
On every clinical trial, a team of biostatistical programmers spends weeks to months writing that code. They take the raw case report form (CRF) data collected at the clinic and push it through two standardized data models, CDISC’s Standard Data Tabulation Model (SDTM) and the Analysis Data Model (ADaM), finally into the specific tables, listings, and figures the reviewer reads. A small derivation error at any stage can silently propagate through the entire pipeline, leaving downstream results wrong but superficially consistent. Examples include a last observation carried forward (LOCF) rule that carries a value beyond its permitted visit window, an analysis population flag derived off by one row, or a controlled vocabulary decoded against a stale version.
Task:
This benchmark compresses that end to end workflow into a single autonomous task. Given raw case report form (CRF) and its specifications, each model must autonomously produce a complete CDISC submission – from raw CRF through SDTM and ADaM to TLFs.
Specifically, in a single autonomous turn, the model writes and executes three Python scripts:
raw_to_sdtm.pytransforms the raw CRF data into 10 standardized SDTM domains, including DM, AE, LB, and VS.sdtm_to_adam.pyderives 7 analysis-ready ADaM datasets from the SDTM domains.adam_to_tlf.pygenerates 13 TLFs from the ADaM datasets.
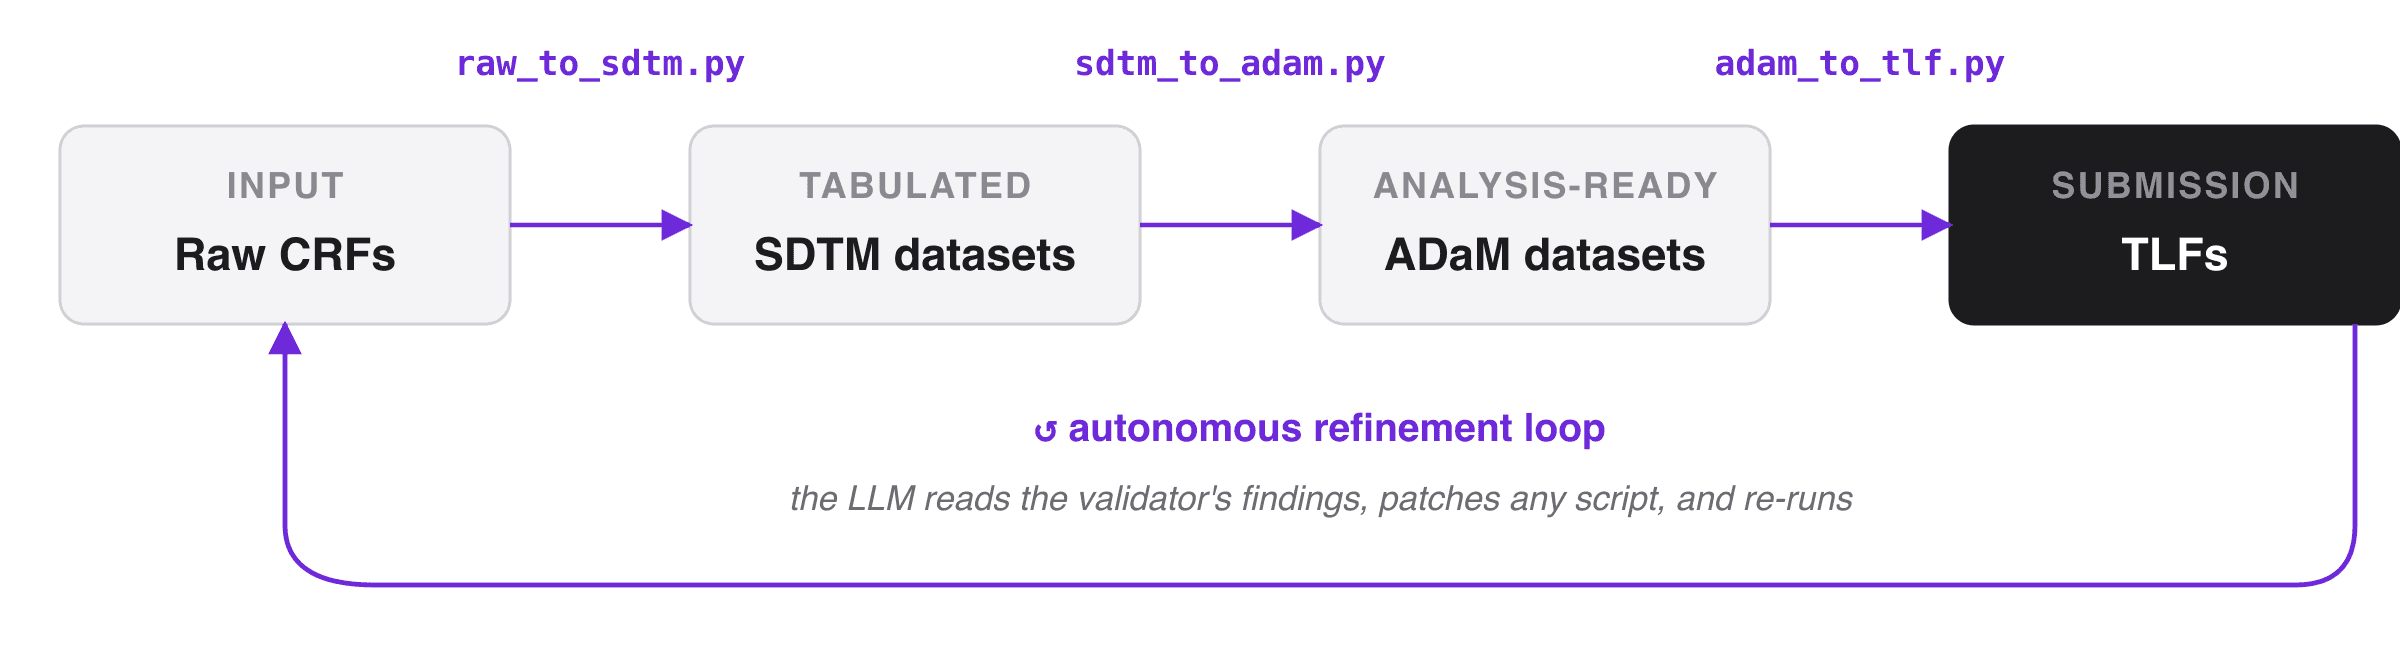
The four data layers of the pipeline and the three Python scripts the model writes between them, inside one autonomous refinement loop.
The 10 SDTM domains and 7 ADaM datasets are set by the CDISC Pilot dataset (the 7 being the analysis-ready subset our outputs draw on). The 13 TLFs are the benchmark’s chosen subset of the tables, listings, and figures that would appear in a full study report.The 10 SDTM domains and 7 ADaM datasets come straight from the CDISC Pilot itself: SDTM organizes a trial’s data into one standardized domain per type of data collected, and this study collected ten — demographics, adverse events, labs, vitals, con-meds, exposure, and so on — while the 7 ADaM are the analysis-ready subset those outputs draw on. The 13 TLFs are the one place we made a choice. A real study report contains hundreds of tables, so we selected a representative set of thirteen spanning the core output types — demographics, efficacy, safety, labs, listings, and a figure — following ICH E3 Section 14 standards on Tables, Figures and Graphs and computing each deterministically from the Pilot's ADaM. So the pipeline is grounded in the public CDISC data end to end; the 13 outputs are the benchmark’s chosen slice of what a full submission would contain.
Dataset
CDISC PILOT01, the public reference implementation of a full CDISC pipeline: a 24-week Phase III trial of Xanomeline vs placebo in Alzheimer’s, 254 subjects, 3 arms (Placebo, Xanomeline Low/High Dose), ADAS-Cog (ACTOT) primary endpoint. Chosen because a published human/SAS reference exists at every layer (SDTM, ADaM, TLF), giving ground truth at each stage, and it is public and model-neutral. Answer key was withheld from the models during TLF generation.
Evaluation
How we score each run
Every run is graded three ways, but only two of them decide the leaderboard (see figure).
An in-loop validator (deterministic, 0–10). While the model works, it repeatedly scores its own output against a deterministic structural check — never against the reference. The validator confirms the pipeline is well-formed: expected files exist, required columns are present, row counts are in range (the subject-level analysis dataset has exactly 254 subjects), key variables are unique, values use the correct controlled vocabulary, derivation invariants hold (e.g. AVAL = BASE + CHG), and each dataset was built only from the layer beneath it. Findings lower the score from a starting 10 in proportion to severity — −1.0 per error, −0.3 per warning, −0.1 per information note, each capped — with a floor of 1.0. The reference answer key is withheld from the model throughout; it works from its inputs and the validator’s feedback. This score is the model’s own feedback signal (how it decides whether to keep iterating) and a pass/fail gate; it does not rank models.
The two reported metrics:
Data accuracy — the objective one (cell-match, 0–1). Every numeric cell in the model’s tables, listings, and figures is compared to the official CDISC reference at a ±0.01 tolerance; composite cells like “mean (SD)” or a min–max range are tokenized so each number is checked independently. The run’s score is the mean of the per-file match rates, weighting every output table equally — so a model can’t inflate its score by nailing the two huge listings (≈88k and ≈12k cells) while missing the 28-cell primary efficacy table, which is the output that actually matters. Tables that can’t be reproduced from the provided inputs —those needing central-lab or vendor feeds absent from the raw CRFs — are excluded, leaving 10 of the 13 outputs scored on their values.
Reviewer panel — the subjective one (LLM-graded, 0–10). Three critics from three model families (Gemini 3.1 Pro, GPT-5.5, Opus 4.8) independently grade each submission against an FDA-reviewer rubric across four axes — code quality, executability, spec conformance, output correctness — and tag every finding by severity. We take the median of the three. Note that all 3 model critics were closed models even as GLM 5.2 topped accuracy on this task.
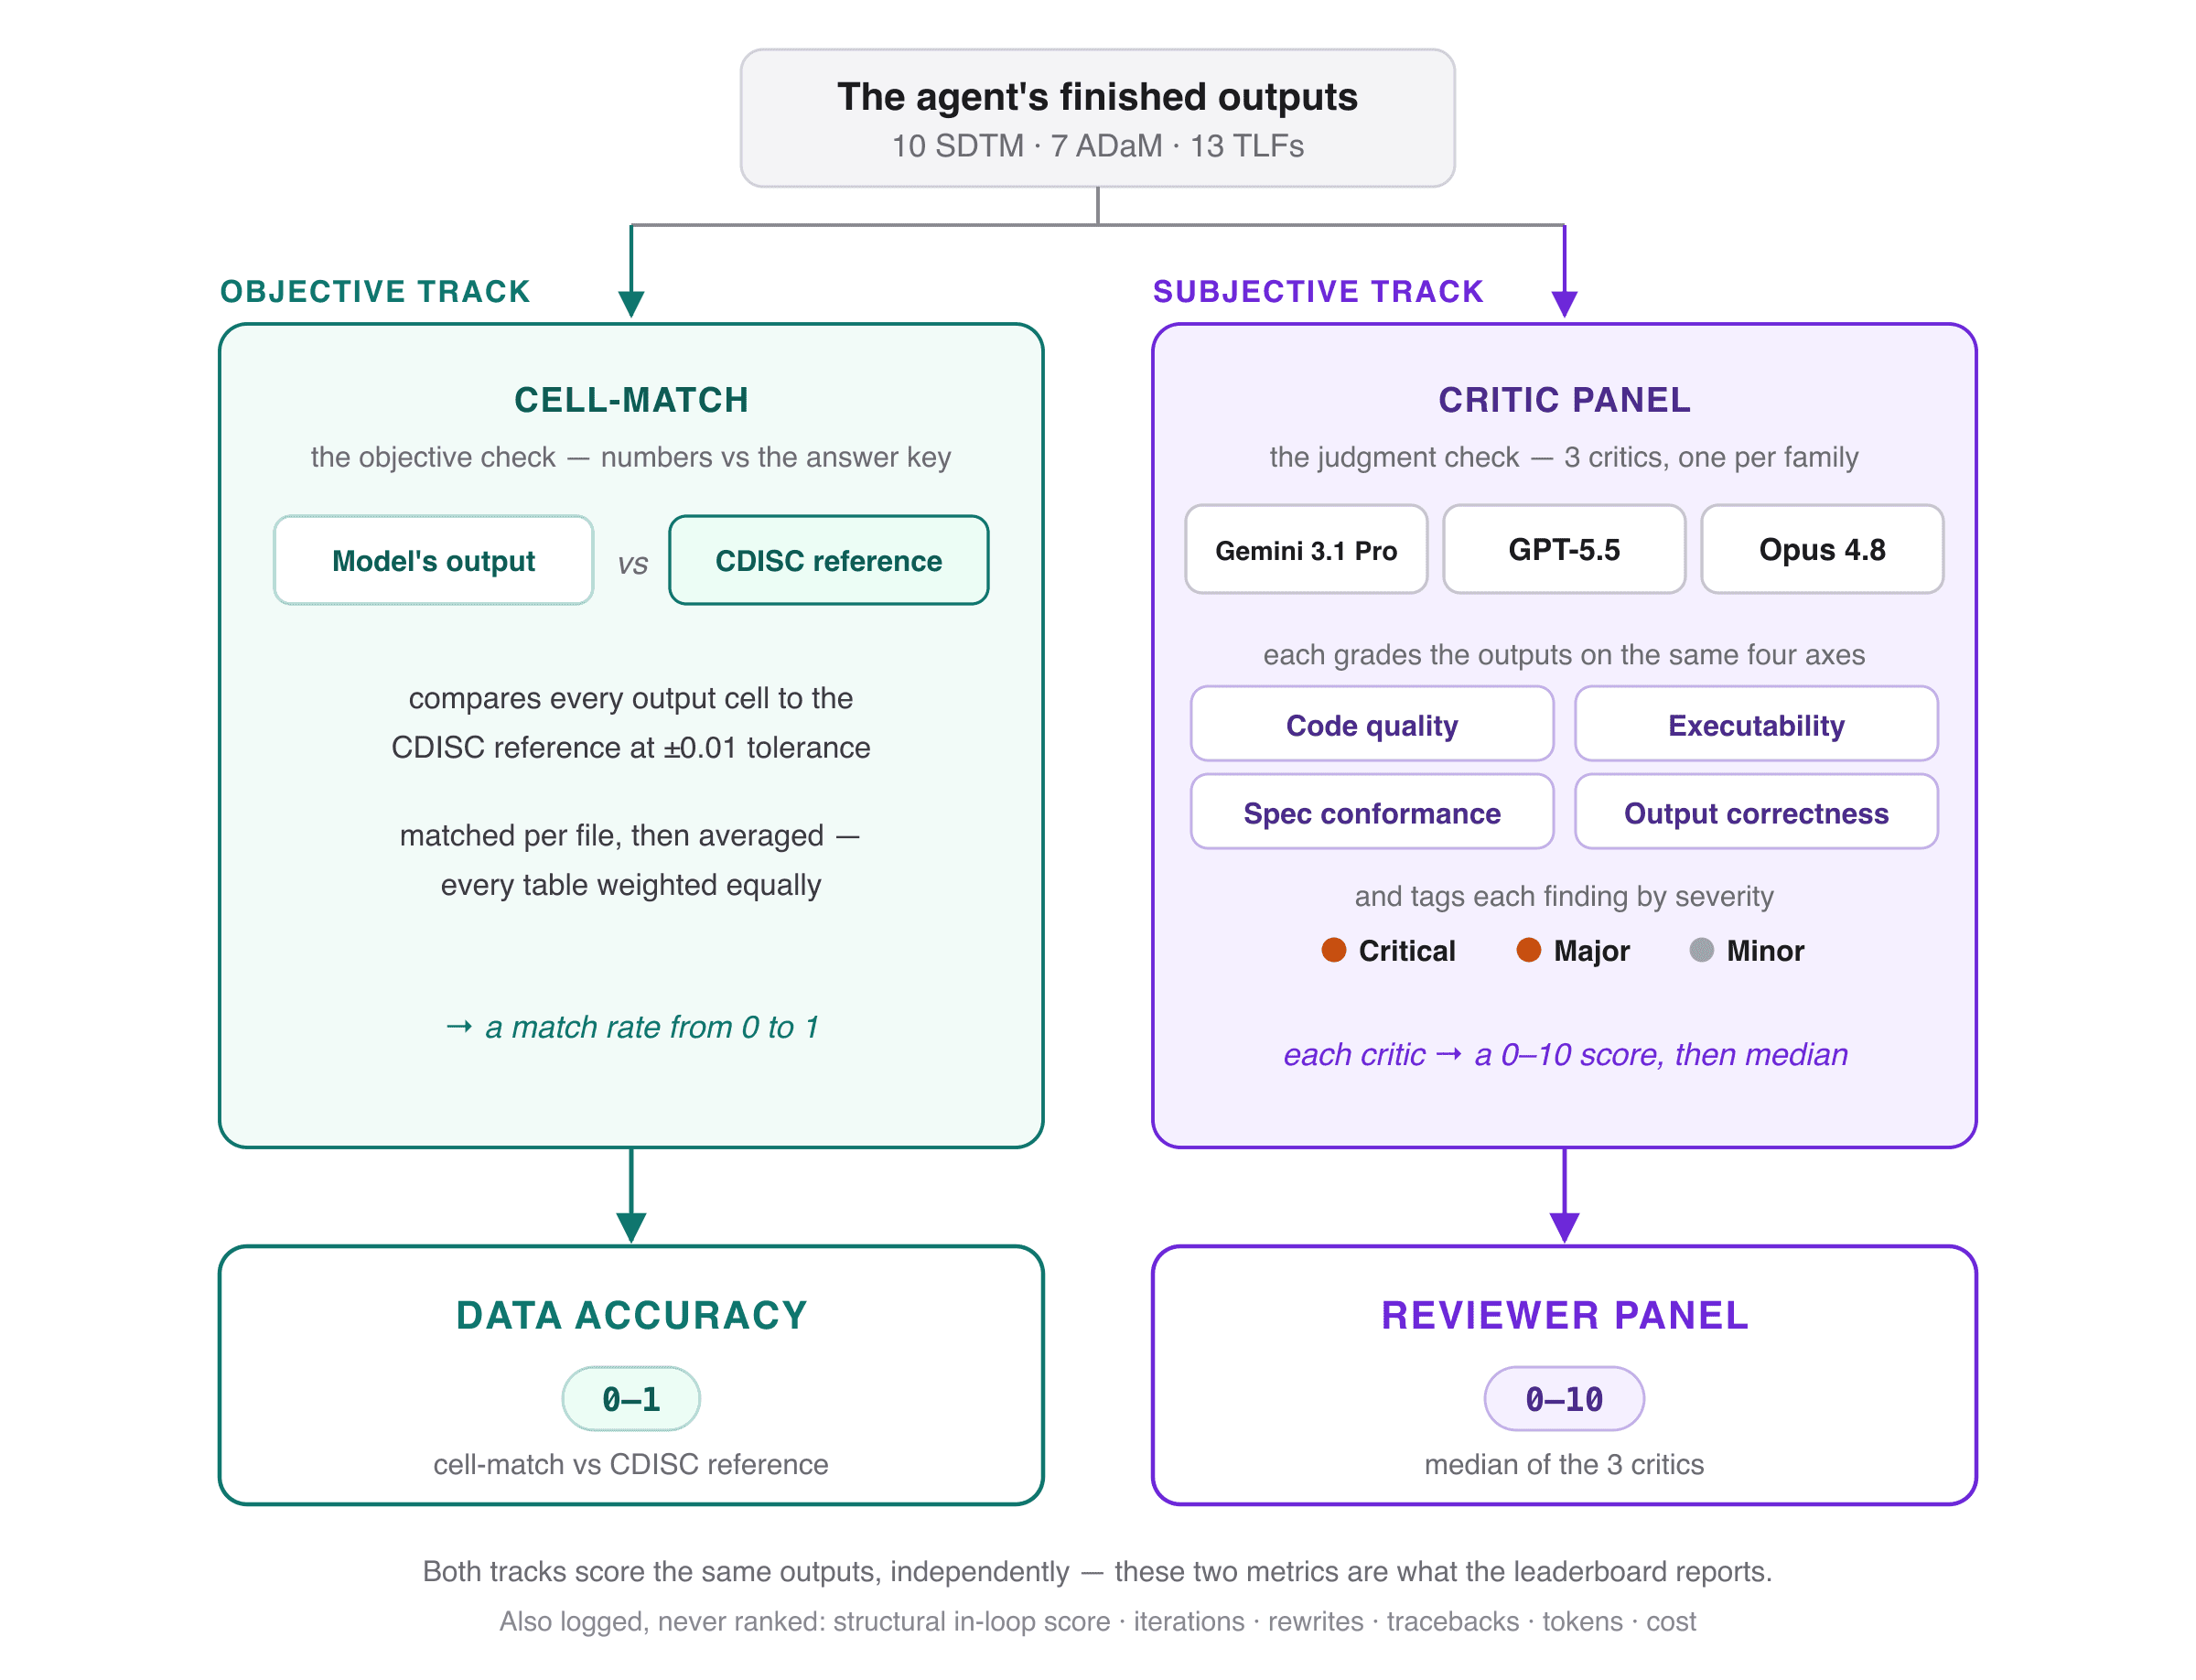
Scoring architecture. The agent’s finished submission is graded on two independent tracks — an objective cell-match against the CDISC reference (data accuracy) and a three-critic panel scoring the same outputs on four axes (reviewer panel).
Normalized TLF score (out of 100) is calculated as follows:
Normalized TLF score = (Data accuracy * 100 + Reviewer panel * 10) / 2
Skills, Harness and Inference Provider
For the 2 agentic tasks above (IND and TLF) we created Skills (using Opus 4.7 + human review) to perform each task, and then ran those skills along with the corresponding dataset. The harness used varied by model:
Harness | Inference provider | |
Claude family (Opus, Sonnet) | Anthropic API | |
GPT family | OpenAI API | |
Gemini | Google Vertex API | |
Open-weight models | Together API, OpenRouter |
In future work, we’ll tease apart the impact of the harness and the model on accuracy, as well as report on the choice of harness and inference provider on the cost and latency of our results.
Overall score
We score each model on each task and then take the mean across tasks into a unified leaderboard view.
For computing cost for each model we take the mean of the cost of all the API calls to that model in a single run across all 3 tasks
In follow-up posts we’ll study the impact of model choice for orchestrator vs generator vs in-loop validation - for the analysis here, we used the same model for each of these.
